


By Steph Primiani, Director of STEM and Alicia Cuomo, Brown University Urban Education Policy Intern
Math Teachers Singing a Different Tune
Who remembers this song or a similar mnemonic? Many people take pride in recalling the procedure for dividing fractions. If you can’t, a quick Google search will provide you with formulas, anchor charts sprinkled with arrows, and even recall strategies for the traditional three-step method most adults were taught as children.
But, can you explain why flipping and multiplying gets you the correct answer?
There are consequences to learning mathematics (like the division of fractions) as computational procedures rather than concepts we can visualize, draw, and explain to one another. When students are not pushed to use visual representations and explain their thinking, they may begin to believe math is meaningless numerical procedures. This frustration only escalates when students move into more abstract algebra.1
In the last blog post, I offered tips for supporting educators as they teach fractions conceptually using the Common Core Math Standards. During their Math Stories block, teachers at Blackstone Valley Prep ask their scholars to use visual fraction models to represent and solve fraction story problems. But, what’s happening outside of instructional blocks to prepare for Math Stories?
Teachers Do the Math
Most adults have been taught fractions in the very way we are trying to improve for our students. As math teachers, we must change our mindset and tool belt before we can be the experts.
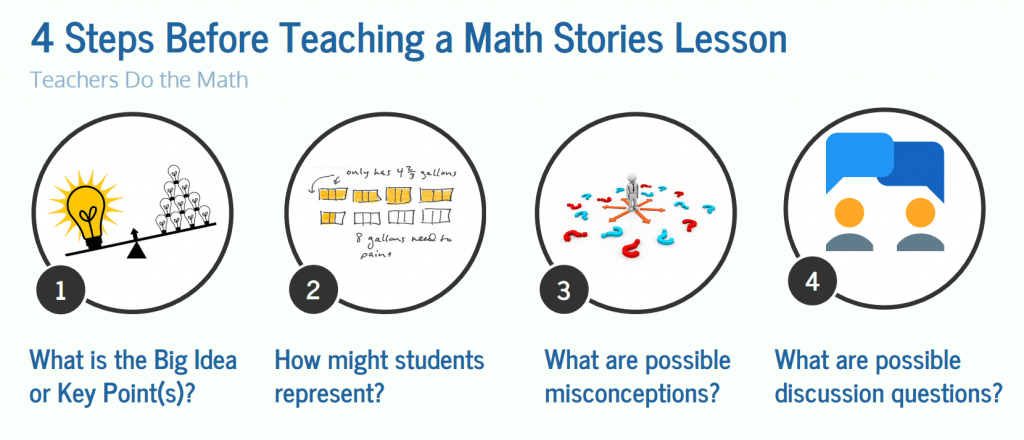
When 5th grade teachers at BVP prepare to teach an approaching Math Stories lesson, they must first get into the students’ mindset. They follow a step-by-step lesson plan protocol to model the math story problem themselves and internalize key takeaways.
Take this story problem for example:
Adelaide drinks ½ liter of water every day. How many days will it take her to drink 4 liters of water?
Step 1: Big Idea 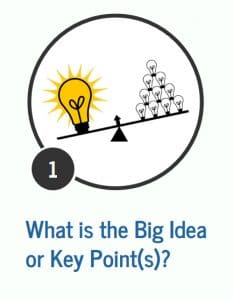
The first thing our teachers do is note the big idea or key point(s) in the story problem. For example:
- Key Point 1: Strong models represent what is happening in the story with detailed labels.
- KP2: Strong fractions models help us solve problems without relying on the algorithm.
- KP3: There is not one “right way” to think about a problem or only one “appropriate operation.” (With grouping addition, kids often rely on addition or multiplication.)
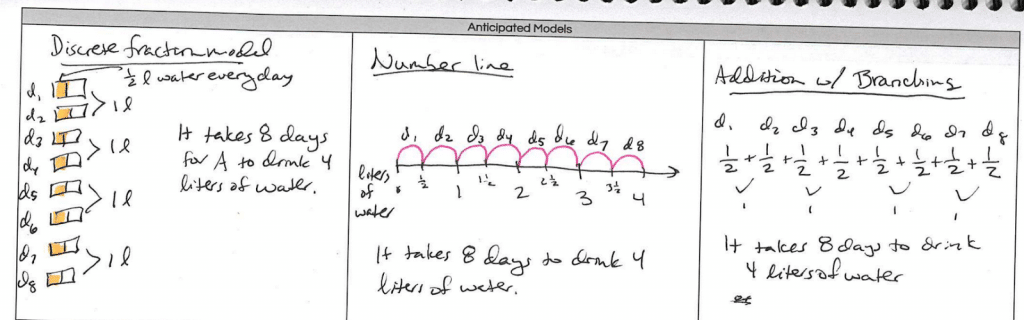
Step 2: Representations 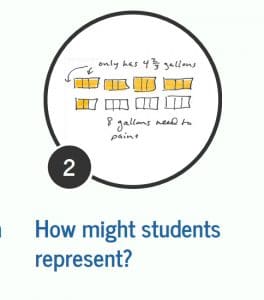
Next, teachers create 2-3 representations they anticipate from students using clear labels. For example, Adelaide’s problem might be modeled using a discrete fraction model, number line, or addition with branching:
Step 3: Misconceptions
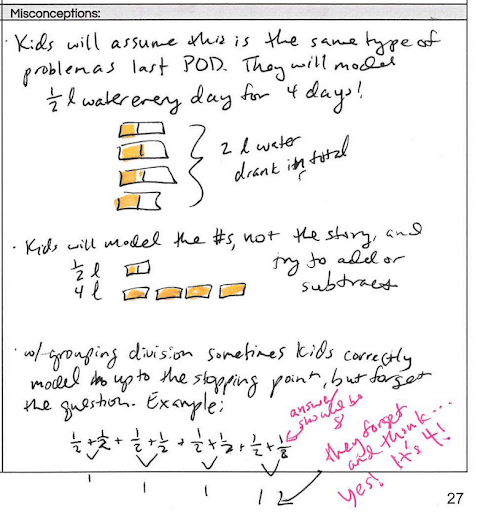
Then, teachers anticipate possible student misconceptions.
For example, in Adelaide’s story, students may model the numbers ½ and 4 from the problem, but incorrectly assume the operation. It’s important to note with grouping division that kids may repeatedly add ½ until they obtain a sum of 4, but forget the original problem restrictions that give us a total of 8 days.
Step 4: Discussion Questions and Exemplar Responses
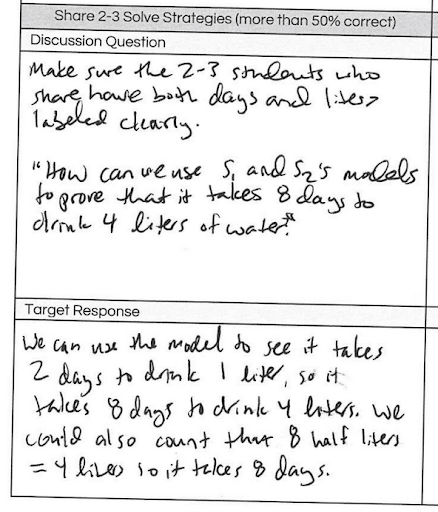
Finally, teachers pre-plan discussion questions for three possible scenarios that can arise while they are monitoring student models. If more than 50% of students are solving correctly, the teacher will facilitate 2-3 students sharing their models with the class using mathematical language. For Adelaide’s problem, the teacher plans to choose 2 exemplar models with clear labels.
Turn and Talk Discussion Question: “How can we use these two models to prove that it takes 8 days to drink 4 liters of water?”
Target Response: We can use the models to see it takes 2 days to drink 1 liter, so it takes 8 days to drink 4 liters. We could also count on the number line that 8 half liters = 4 liters, so it takes 8 days.
The student shows flexible thinking and uses labels to make the explanation clear.
Click here for an example of a completed lesson plan from Math Stories and here for a blank template.
Is it Worth it?
When teachers model math problems in multiples ways, identify key points and aligned discussion questions, and anticipate misconceptions as part of preparing for teaching fraction story problems, they have increased confidence in front of students and are better able to facilitate a student-led discussion.
Further, when the teacher is planned for different levels of student understanding, they are able to use in-the-moment data to facilitate a discussion that meets the current needs of students and nudges them towards conceptual understanding and mastery of the standards. By knowing what to look for during application, the teacher can leverage the power and voice of students through their models rather than relying on teacher-led lecture. This approach cultivates a room of young mathematicians who are more likely to take risks and feel comfortable making mistakes.2
Want to Learn More?
In the next few posts, we will explore the different parts of the Math Stories protocol as well as the power of student talk.
Have questions? Reach out to BVP’s Director of STEM, Steph Primiani at sprimiani@blackstonevalleyprep.org and follow me on Twitter @stephprimiani
Resources
1 The Challenge of Fractions, NCTM.
2 Domino. “Teachers’ Influences on Students’ Attitudes Towards Mathematics,” 2009.