Meaningful Results
At BVP, we know that standardized tests align strongly with college and career success.
We also know our scholars are much more than a test score.
Because we are committed to preparing every scholar to achieve their goals for college and the world beyond, we spend a great deal of time examining and analyzing assessment results. We use them to help us determine what each learner needs next in their education. More broadly, results allow us to take a closer look at our practices, shine a light on what is working, and determine what changes need to be made to improve our model and better serve our scholars.
These figures are only a part of what we do to prepare a child for what lies ahead. In addition to academics, we pay careful attention to both the social & emotional and cognitive & non-cognitive growth of every scholar. So while we are proud of our academic data, we are equally proud of the overall and continuous growth of our scholars.
The Center for Research on Education Outcomes at Stanford University
In June 2023, CREDO, the Center for Research on Education Outcomes at Stanford University, published its third national study evaluating the academic progress of students enrolled in charter schools in the United States. You can view/read the full report here. Of note, Rhode Island is the state with the most student growth in charter schools in both mathematics and reading between its 2013 and 2023 studies (page 51). Additionally, Rhode Island charter school students receive, on average, 88 additional days of learning in mathematics and 90 additional days of learning in reading versus their peers in traditional districts!
2022 PSAT Results
On the 2022 PSAT, BVP has the best results it has ever seen in both English and math. In English, 63.8% met the college and career readiness benchmark, beating the state average by 4 points. In math, 42.3% met the benchmark, outperforming the state by 13 points. And, BVP was one of the highest performing charter schools in the state, ranking first on PSAT math and second on PSAT English. On the SAT, BVP was the top performing charter school in the state in both categories. It’s also worthy to note that many of our subgroups, including those who are economically disadvantaged and those who receive accommodations, outperformed their similar peers in all four of our sending districts.
2018-2019 SAT Results
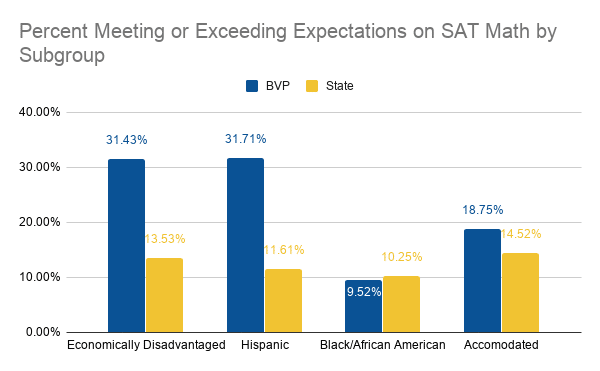
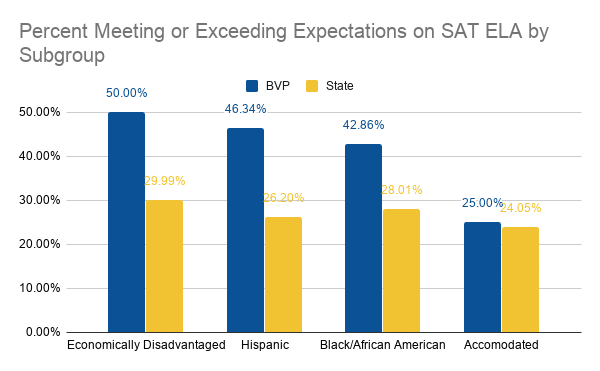
We are pleased to report that BVP scholars outperformed their peers both in the state of Rhode Island and nationally on the SAT. BVP averaged 490 on SAT Math, compared to the state average of 474 and a weighted average from BVP’s sending districts of 420. BVP averaged 487 on English Language Arts (ELA), compared to the state average of 483 and a weighted average from BVP’s sending districts of 428. Indeed, BVPHS’s overall academic achievement is extraordinary, with SAT results that also edge out the national average (977 versus 973).
More so, in looking at subgroup data, our scholars from low-income backgrounds dramatically outperformed their like peers statewide with scores of 969 versus 859.


2018-2019 RICAS Results
2019 marked the second year of the Rhode Island Comprehensive Assessment System (RICAS) in grade 3-8 in English Language Arts (ELA) and mathematics.
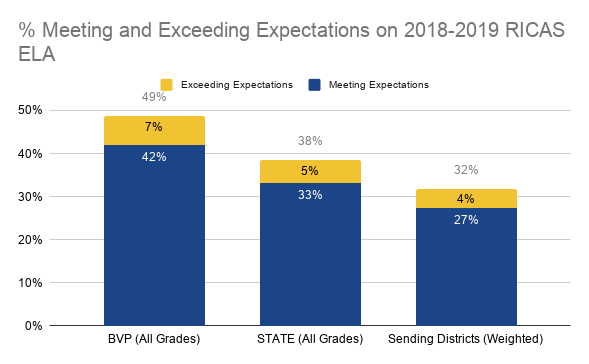
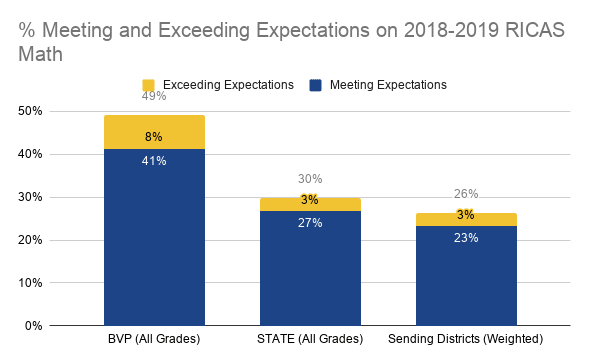
For the second year, BVP outperformed the state proficiency averages by double digits in both ELA (49 versus 39) and mathematics (49 versus 30), despite serving a much higher percentage of scholars from low-income backgrounds than the state population. Indeed, BVP scholars from low-income backgrounds outperformed their like peers statewide by 20 points in ELA and 26 points in mathematics.
Middle School 1 saw the largest percentage of students make High Growth in mathematics (62%) of any middle school in the state!
Detailed data is available on RIDE’s assessment page.


