By Steph Primiani, Director of STEM and Alicia Cuomo, Brown University Urban Education Policy Intern
Put Your Pencils Down!
What do 5th grade teachers at Blackstone Valley Prep say is the first step to problem solving? “Put your pencils down!”
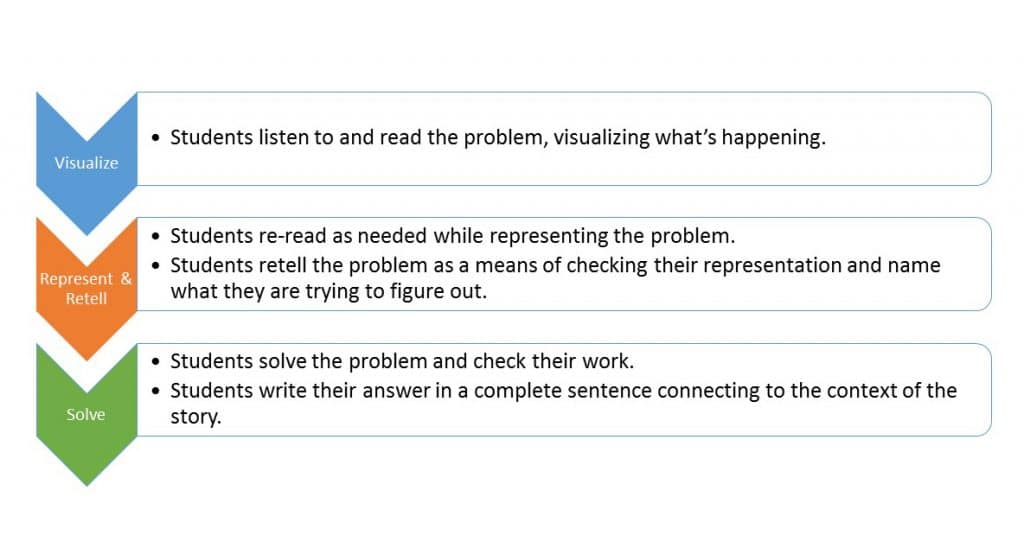
Middle school scholars at BVP are in the second month of implementing the Math Stories protocol, which uses materials from FirstLine Schools in New Orleans to focus on fraction story problems. The 20-minute block is called Math Stories and pushes students to follow a structured 3-step protocol each time they approach a story problem.

In a past blog post, I spoke about the importance of teaching mathematics as concepts we can visualize, draw, and explain to one another, rather than as mindless algorithms. But, how exactly does the Math Stories protocol reinforce visualization and conceptual understanding?
Make a Mind Movie
Let’s consider the following story problem:
Renee eats 3/4 of a bag of popcorn. Maria eats 1/2 of a bag of popcorn. How much popcorn did Renee and Maria eat altogether?
Scholars silently scan the story problem as Miss Palumbo reads it twice. “Pencils down,” she gently reminds them, encouraging them to visualize what’s happening in context.
It’s useful to imagine Renee and Maria. Maybe they’re sitting in a movie theater or in front of a television. There are two bags of popcorn, and we’re interested in finding the total eaten. Visualizing the situation and identifying known and unknown information is an important first step to representing and solving a story problem. After the problem is read twice, students note the question and information on a recording sheet.

But, something powerful is happening before students jot down key information. As students are listening, they are beginning to visualize a mathematical model in their mind. By drawing this visualization as a representation, students solve in a way that makes sense to them and can be explained to others.
Visualization to Representation 
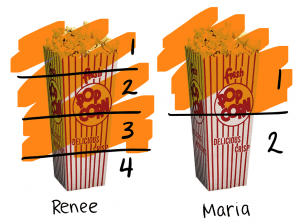
Students may have visualized Renee’s popcorn bag broken into 4 equal parts and Maria’s popcorn bag broken into 2 equal parts. Before using a representation to solve, students are imagining partitioning and can visualize that the units are not the same.
This visualization, or mind movie, will help students represent using a clearly labeled model. The representation helps the student solve and is used to justify their reasoning to a peer.
Allowing students to visualize a problem and choose a process that makes sense to them naturally results in a variety of approaches. This cultivates confidence through a classroom climate that cares more about communication and flexible skills than “getting the right answer.” Students naturally move from concrete strategies to more efficient, abstract methods. When students are taught how to draw models that represent what they’re thinking, they’re in charge of their own learning. No matter the complexity of the problem, students can grapple with the skills they have in the present.
In this student-centered approach, scholars solidify understanding of mathematical concepts by representing and solving story problems multiple ways. Further, they’re engaged because the strategies are coming from their peers. The teacher’s role is to collect data on how students represent, make a decision about which representations will be shared with the whole class, and facilitate a discussion about a mathematical key point.
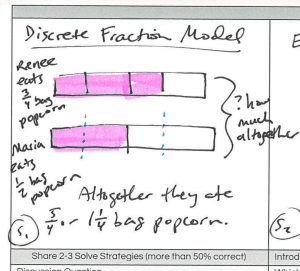
Discrete Fraction Model
Visual:
Students who visualized breaking each popcorn bag into parts of a whole and adding the parts together.
Model: 
Students can draw a tape diagram to show iteration or partitioning.
Target Student Response:
I know from adding and subtracting whole numbers that we need the same units. I used a strategy called partitioning and a tape diagram model to show ½ and ²/₄ are equivalent fractions. Halves and fourths are different units, but if I rewrite ½ as ²/₄ , I have the same unit. I can add ²/₄ and ¾ to get
⁵/₄ or 1 ¼.
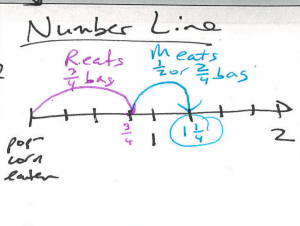
Number Line
Visual:
Students who visualized Renee eating almost one whole bag of popcorn and then Maria eating some, but less than Renee.
Model: 
Students can draw a number line to show iteration or partitioning.
Target Student Response:
I know from adding and subtracting whole numbers that we need the same units. I used a strategy called partitioning and a number line model. I started by drawing 2 wholes to represent the 2 bags of popcorn. Then I broke the wholes into 2 equal parts to make halves and again to make fourths. I used hops on the number line to show what Renee eats, ¾ , plus what Maria eats, ½. The last number is the total, or what they ate altogether, which is 1 ¼.
Strengthening Visualization Skills
How can you enhance students’ ability to visualize story problems?
Use a variety of models
To develop a deep conceptual understanding of fractions, it’s important for students to use multiple models to represent the same story problem and learn new strategies for representation by discussing peer work.
Connect fractions to what students already know about whole numbers.
It’s important for teachers to introduce fractions by connecting them to what students already know about whole numbers and continue stressing this relationship.
Teach Iterative Language
Many adults are familiar with partitioning, or breaking up a whole into equal parts. Think slices of pizza and pie charts. However, much research points to the importance of students also having an iterative viewpoint. In other words, seeing 3/4 as a count of three parts called fourths.
Fraction symbols are just a shorthand for saying how many and what (Van de Walle et al.).
Why Does it Matter?
The Math Stories visualization protocol is a critical component that supports students in creating meaningful mathematical models. Drawing and sharing visual models in context enhances students’ approximate number system (ANS), which is correlated with improved symbolic-math, or arithmetic ability (Park & Brannon, 2013). In other words, thinking visually isn’t a replacement for symbolic operations–it’s an indispensable skill that strengthens our ability to think abstractly.
Have questions? Reach out to BVP’s Director of STEM, Steph Primiani at sprimiani@blackstonevalleyprep.org and follow me on Twitter @stephprimiani


