


By Steph Primiani, Director of STEM and Alicia Cuomo, Brown University Urban Education Policy Intern
What were they thinking?
Have you ever read a student’s response to a math question, turned to the colleague grading next to you, and asked: What were they thinking?
Well, research about boosting mathematical achievement says teachers should be asking this question–regularly.
In the most recent blog post, I spoke about the research supporting growth mindset and how students learn from making mistakes in math. But, how do we use data to measure student learning? What are best practices for data collection and analysis that promote student growth without exhausting teachers or damaging students?
Data Collection in Math Stores
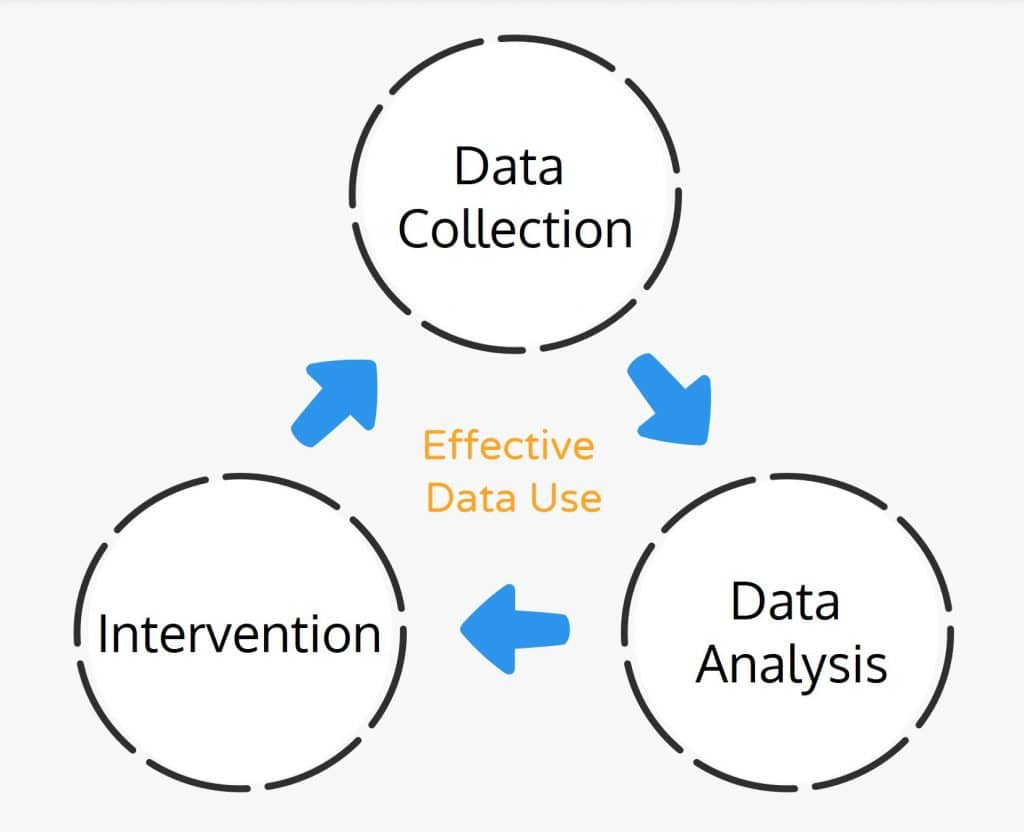
The National Council of Teachers of Mathematics (NCTM) describes effective data use as a continuous cycle with three steps: data collection, data analysis, and intervention.1
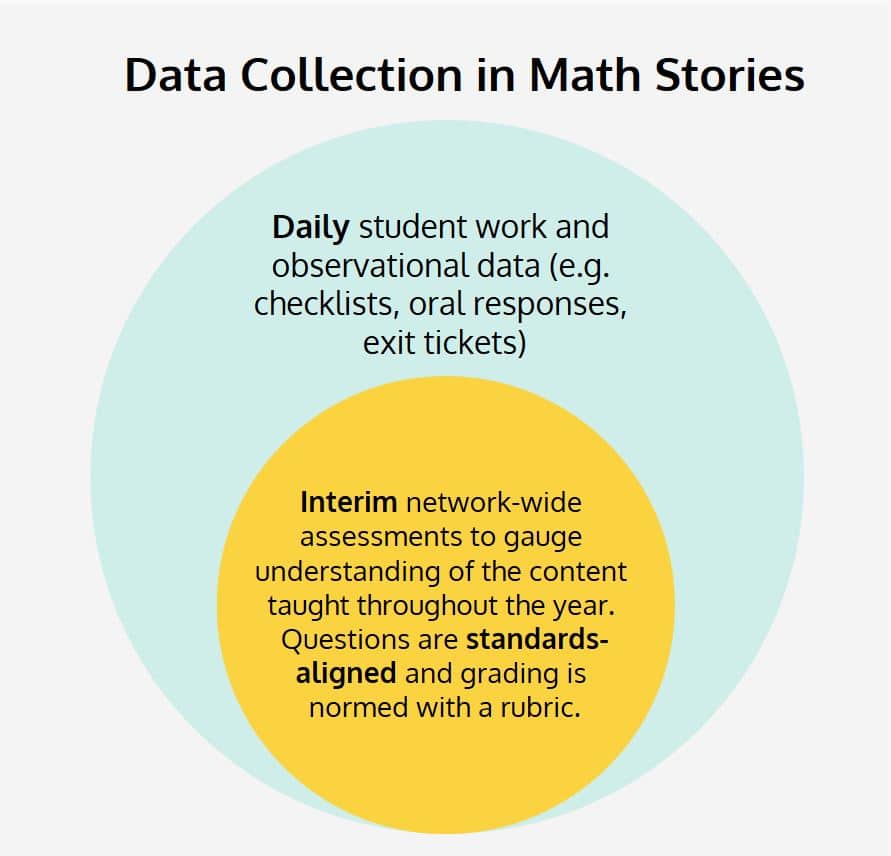
The Math Stories instructional block has two sources of data collection. Every day, teachers collect observational data connected to the key learning targets.
Additionally, students take network-wide interim assessments to gauge understanding of story problem content taught throughout the year.
Observational Data
One of the strengths of the Math Stories protocol is that students are doing the heavy lifting, which frees up teachers to observe what and how students are learning.
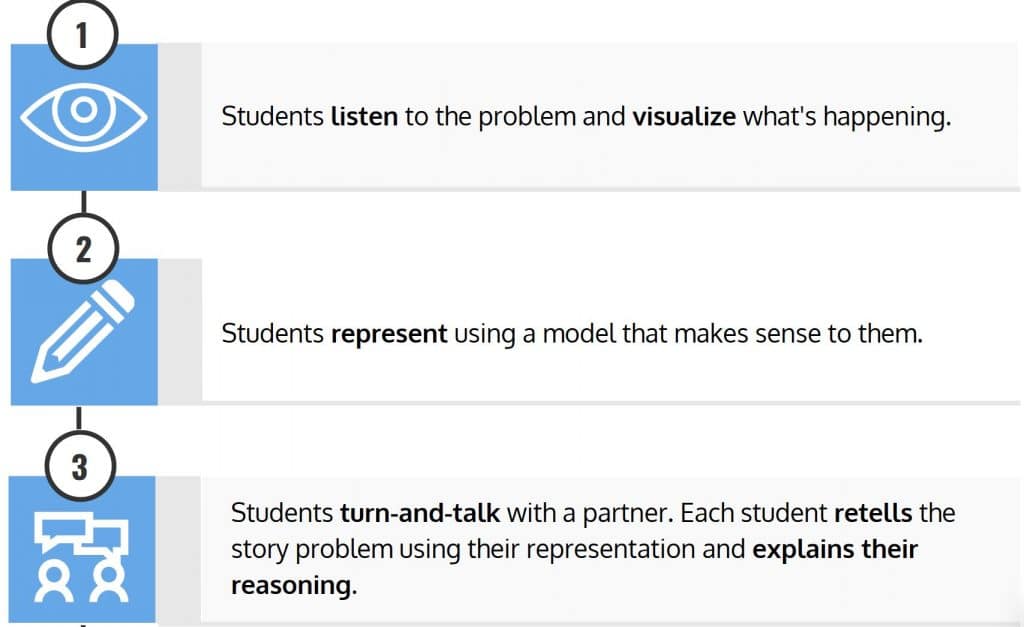
Specifically, while students are engaged in a turn-and-talk with a partner about their representation, the teacher is busy aggressively monitoring using a data tracker. I spoke in a past blog post about how the data tracker allows teachers to quickly gauge what percent of the class represented correctly and facilitate a meaningful discussion in response to the student work happening.
Collecting observational student data can feel taxing. It’s important to show students that you care about their thought process and the quality of their work, but checking in with every student every day to take personalized notes is not possible nor your best use of time. How do you systematically examine student work from class?
In the Math Stories scope and sequence, problem types intentionally increase in rigor and spiral. As students develop understanding of a problem type, they move towards abstract representations, increase efficiency, and are able to better articulate their reasoning to others. Once teachers identify a priority standard (more on that later) they may look at student growth over time pertaining to one problem type.
For example, let’s consider the following story problem:
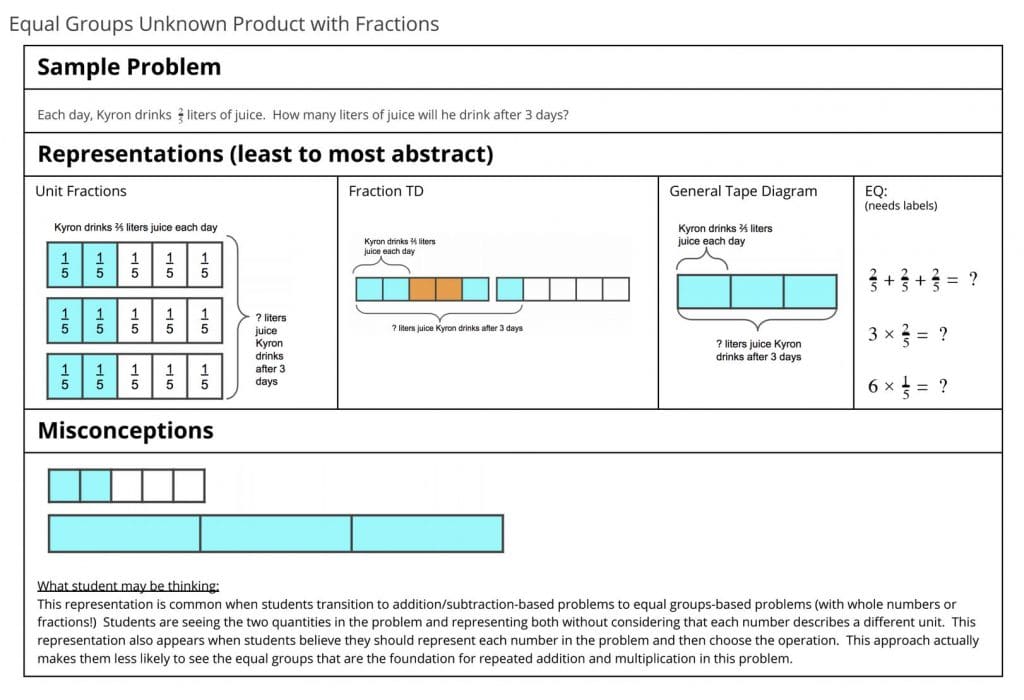
Each day, Kyron drinks ⅖ liters of juice. How many liters of juice will he drink after 3 days?
The Kyron problem is an equal groups unknown product with fractions. This problem type can be visualized and represented several different ways:
A data tracker by standard would assess student performance on story problems measuring the same standard. It may look like this:
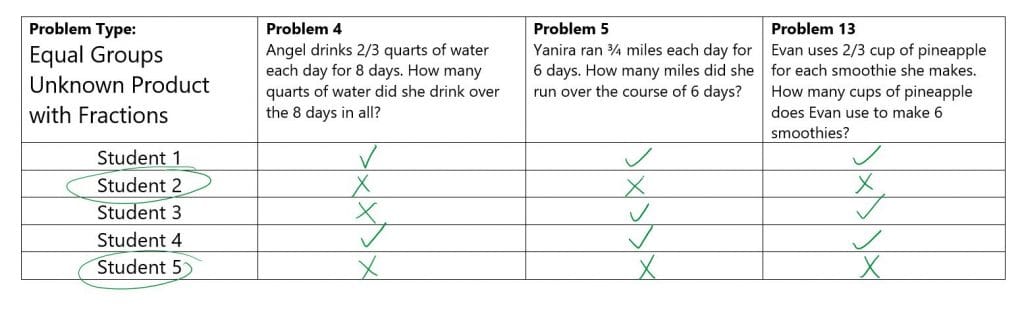
Or this:
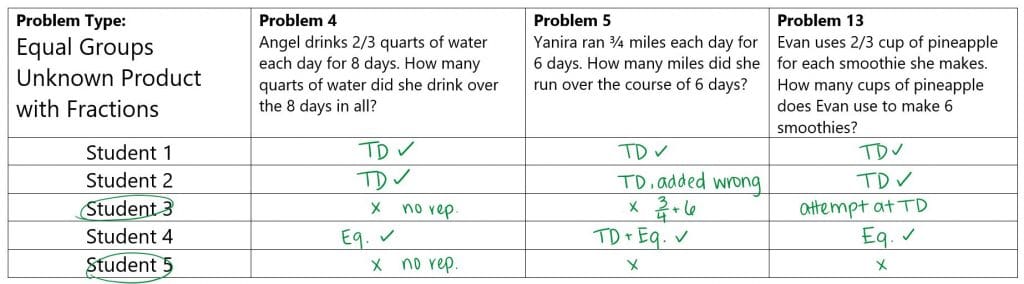
Data trackers are not meant to put students into groups by ability. However, trends and patterns can help teachers gauge how students are integrating lessons, identify small groups who would benefit from additional intervention (e.g. manipulatives, re-teach of related foundational skills), and create mixed-ability partnerships. For example, in the above checklist, Student 1 is consistently solving correctly, but is only using a tape diagram to represent his work. He may benefit from being paired with Student 4, who has successfully used a tape diagram in tandem with an accurate equation.
Interim Assessment Data
At BVP, interim assessments are given throughout the school year during Math Stories to evaluate how students are reasoning with and solving story problems in relation to yearlong standards. Grading is normed among teams using a rubric, and the simple two item criteria (representation and solution) allows less subjectivity to interfere with analysis. This type of assessment allows teachers to identify trends and determine action steps.
Approaches to analyzing data vary among schools. Achievement Network has an excellent analysis notecatcher with four steps:
- Choose priority standards for analysis, and study the language of the standard.
- Solve items assessing priority standards and compare to problems and exercises used in instruction.
- Analyze data and student work to identify areas of success and struggle. Form a hypothesis about why students struggled.
- Decide how you will address student skill gaps and misconceptions in upcoming instruction.2
This process supports teachers in empathizing with students as learners. Teachers closely examine the language of the priority standard and associated foundational skills. Next, teachers solve story problems that assess the chosen standard while reflecting on their own lessons and the level of student engagement. They ask: What may have caused students to struggle? Teachers then examine student work related to the priority standard, sorting by common trends.
Analysis of the standards, student work from the assessment, and instructional gaps allow the teacher to hypothesize what students understand and do not understand. The final step is to make a plan for how and when to re-engage students with the content in a new way.
Reporting Data
Observational Data
Data trackers are flexible to the style of the teacher, but it’s important to note that they’re teacher-facing tools. Math Stories instruction is meant to be messy. Students are intentionally challenged to navigate mathematical situations that they haven’t been taught explicitly yet, so that when new methods are introduced, they have a springboard for understanding the purpose of their application. Researcher D.L. Schwartz called this concept “a time for telling:”
“The researchers found that when students were given problems to solve, and they did not know methods to solve them, but they were given opportunity to explore the problems, they became curious, and their brains were primed to learn new methods, so that when teachers taught the methods, students paid greater attention to them and were more motivated to learn them.”3
In the beginning of the year, students may need to grapple with mathematical situations they haven’t explicitly learned. Halfway through the year, students have learned different model and solve strategies for all the problem types, but need to transfer knowledge from the math core block without direct teacher guidance to make these connections.
In a program that encourages risk-taking and exploration, it’s detrimental to students to grade their developing knowledge and skills. It may be helpful to openly talk to students about data trackers as teacher tools to visualize growth rather than a reflection of how smart or fast individual students are.
Interim Assessment Data
Sharing score data with students can be a positive, motivating experience when we celebrate growth. At BVP, students take a standards-aligned diagnostic assessment at the beginning of the year for Math Stories. This baseline data is used to measure student growth on interim assessments and how much they’ve grown in one year based on results from the summative assessment.
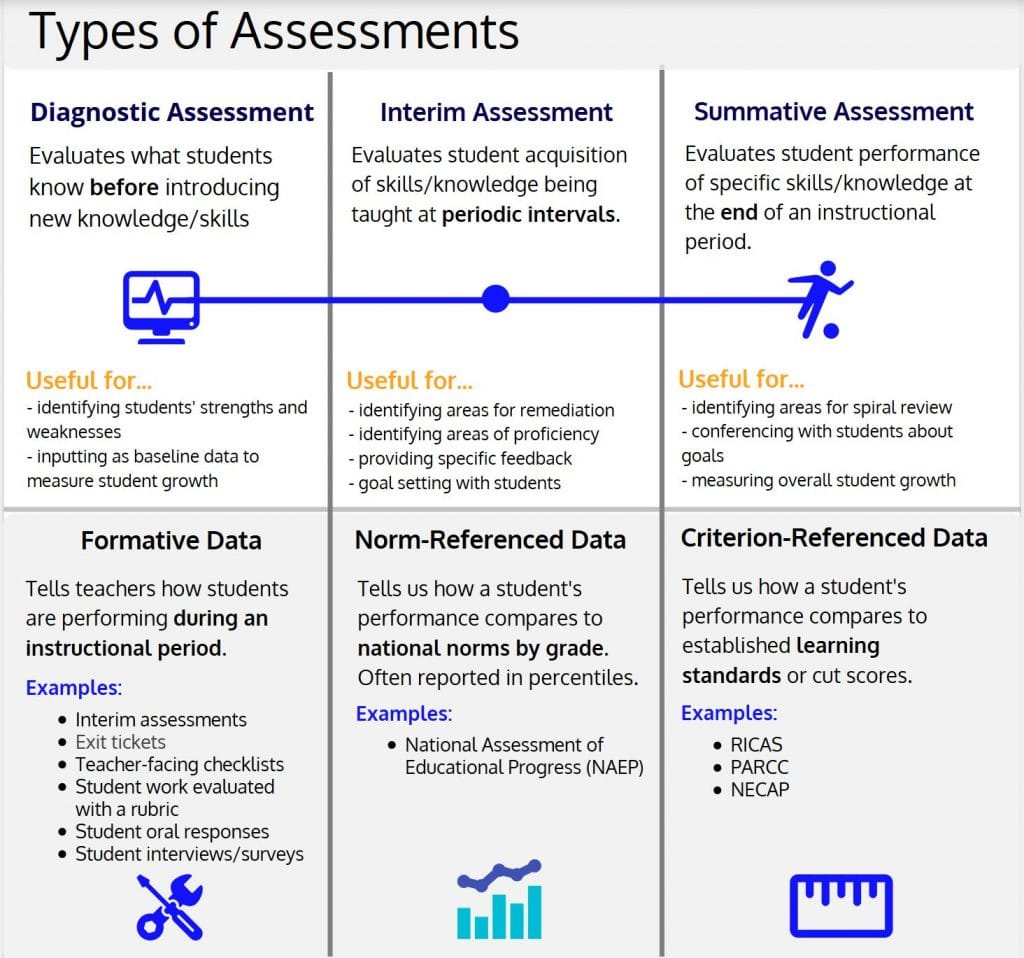
Similar to statewide tests like RICAS, the Math Stories assessments are criterion-referenced.4 The results tell us a student’s performance and labels it on a scale from “not meeting expectations” to “exceeding expectations” based on predetermined cut scores. Additionally, it provides school, district, and state average scores. However, a child’s achievement level is not contingent on the performance of their peers also taking the test as in norm-referenced data.
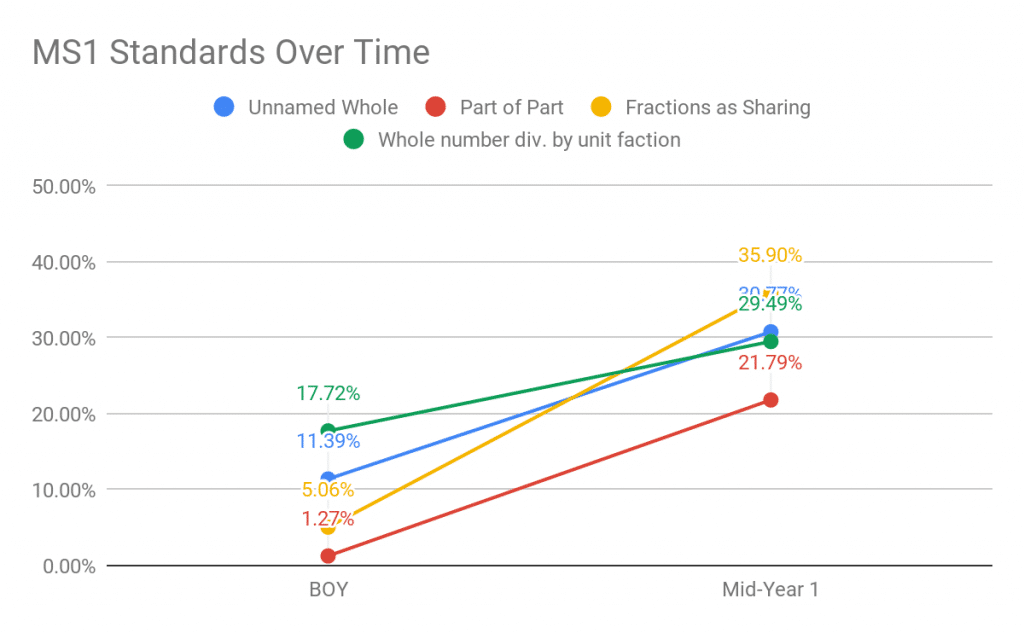
This approach is also useful for comparing classrooms within the BVP network and providing targeted support. Recently, BVP compared its diagnostic beginning of the year assessment to its midyear assessment to measure growth according to standards.
Keep in mind that students must have an accurate answer and completely labeled representation to get full credit. At Middle School 1, 62% of scholars improved their score.
Growth is something to celebrate, for the students who are learning new skills and knowledge, but also for the teachers who are using data analysis to maximize instructional time and fill gaps.
Resources
1 NCTM. (2010) Using Data.
2 Achievement Network. Math Analysis/Adapt Instruction Notecatcher.
3 Boaler, Jo. (2016) Mathematical Mindsets.
4 Rhode Island Department of Education. (2018) RICAS 2018 Individual Student Reports for Parents/Guardians.
Have questions? Reach out to BVP’s Director of STEM, Steph Primiani at sprimiani@blackstonevalleyprep.org and follow me on Twitter @stephprimiani